For many community websites, cost is key, and free is best. SiteMeter, StatCounter and Google Analytics all offer free and easy-to-install and use measurement packages. All of these services work by placing a small bit of cookie-generating Javascript code in an element that appears on every page of your site. Google Analytics is generally felt to be among the strongest of the free options. It allows for tracking of global data, such as unique visitors and page views, and has considerable options for drilling down to show you which content is the most popular, how people are discovering it, and what paths they’re taking through your site. (There’s also an e-commerce component best left to another day.)
To install Google Analytics on your site, you’ll need a Google ID (such as a Gmail account). Then you’ll create a site measurement account and be sent to a screen that asks your site’s URL (Web address) and a few other identifying details. Once you agree to the terms and conditions, you’ll be given a piece of tracking code, like this:
You’ll be told to paste the tracking code into the template of every page on your site above the HTML </body> tag. It’s pretty simple, if you know HTML and templating. But get help, if you need it, from your site coder. Make sure to put the tracking code in every page template you want measured.
How Much Traffic Do I Need?
How much traffic equals success depends on your site. A leading newspaper site, such as NYTimes.com, will measure monthly page views and uniques in the hundreds and tens of millions. A small, local website can be happy with thousands of page views and uniques, at least to start. A focused community of a few thousand people can have influence and also start to garner interest from sponsors or advertisers.
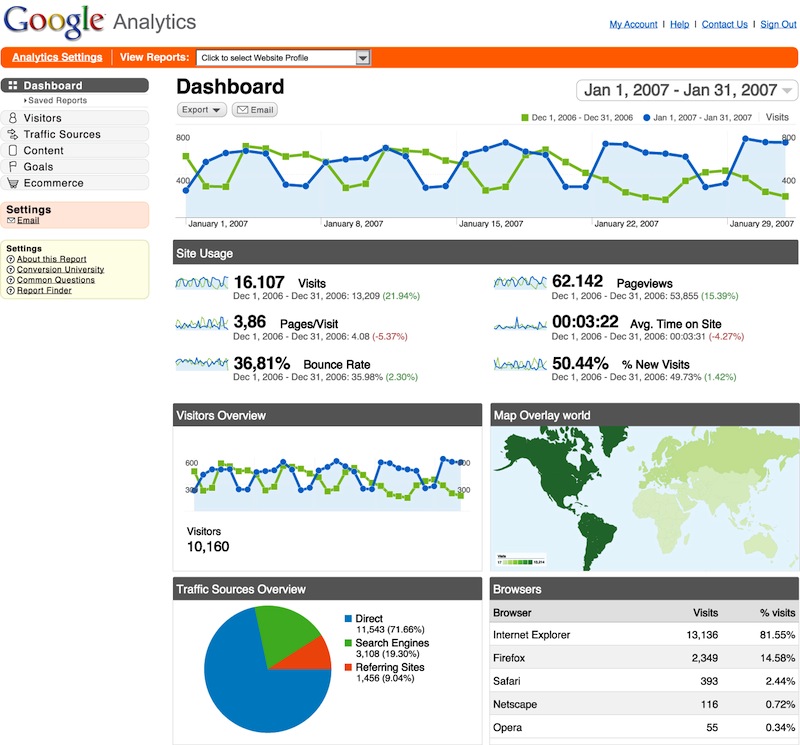
Once you’ve pasted the tracking code and waited up to a day or two, you should see numbers start to appear in your Google Analytics dashboard, as above, as well as on the detail pages that have more granular information.
Google Analytics allows you not only to see the info on visitors (such as how many and how often), content (such as most popular and entrance and exit paths), and sources of traffic, it also lets you export the data into spreadsheets (such as Excel). This allows you to create or customize your own charts.
If you’re able to pay for an analytics package, you can get even more. For example you can get the the ability to create “segments” that track groups of users depending on how they come into your site, so-called funnels to see where people are entering and how close they’re getting to pages you want them to see, and deeper details on users’ regions and whether they’re rejecting cookies. Often, you can sync these applications with registration or other databases. Reliable vendors include Omniture (which has purchased the popular Visual Sciences and WebSideStory Hitbox solutions), and WebTrends.