You must pick measures to gauge your success over time and figure out whether moves you’re taking are leading to success. These are often called your “key performance indicators” or KPIs. Choose from among the available tools (see sidebar “Know the Basic Tools” for an explanation of some) and then configure your mix:
Define your measures of success
A community-oriented site targeting specific groups in that community might want to see growth in new and repeat visitors and in time spent on certain areas of the site, such as a discussion board or photo area. A site with lots of breaking news might expect traffic fluctuations as news ebbs and flows. A site reaching out to local blogs might measure success in terms of the increase in visitors being referred from those blogs. A site that draws traffic from e-mail it sends to the community might see a lot of “direct” visits that don’t come from search engines or referrals from another site, but rather indicate that people have visited the site without clicking on another site’s or search engine’s link.
Understand your community and how you’re serving them
If you aim for lots of discussion or user submissions, see if those content areas are among your most popular. Are you targeting a specific geographic community? Web analytics software uses IP address information from Internet Service Providers to figure out where people are coming from, usually down to a city level. Experts say the information is generally above 90 percent accurate.
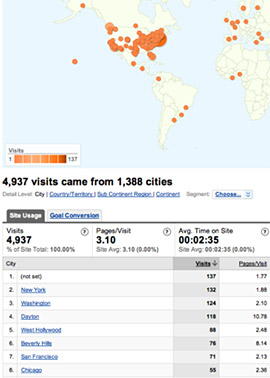
A “city-level” geographic report from tracking software Google Analytics.
If your audience is not coming from your defined community, that’s a strong indication you’re not reaching who you want to reach. At one blog targeted to the New York media community, for instance, a post on an ad about supermodel Kate Moss appearing nude in a billboard brought a tremendous amount of traffic to the site. But the site’s analytics package showed that most of the traffic to the post was via a site that writes about pornography. Furthermore, the majority of people who viewed the post left immediately and did not visit other parts of the site. In gauging success for the month, the blog then excluded most of the traffic to that post, because the people who came in to view it were not in its target audience.
Watch referrals, especially from search engines
Nearly all your traffic will come from three sources: direct links (someone types your URL in a browser or clicks their own bookmark or an e-mail link), a referring site (a link from another site), or a search engine. Often, the largest slice is from search, especially Google. Your analytics software will tell you what keywords and terms people typed in search engines that led them to your site.
Once you have your measures, you’ll see typical patterns for your site. Then you can set goals for growth or percentage increases you’d like to achieve. You can see if, for example, adding one more story or blog post per day increases traffic, and by how much, then set a target number of unique visitors and page views over six months or a year. You can add more headlines to a page, or change wording or move items around on a page. If you see a certain kind of story gets a spike in page views, you can do more of that kind of story, or drill down into the analytics package for data on that story to see what more you can learn.
Here, with some images, is one example of a metrics report for a locally focused site that uses Google Analytics for its tracking (more on using this software below). We’ve removed identifying markers to protect the site’s confidentiality.
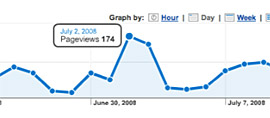
For this site, Google Analytics showed a spike in page views on July 2:
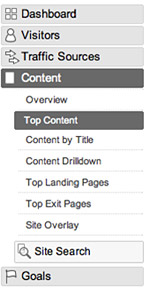
 We clicked on the “Top Content” area under “Content” in the navigation …
… and limited the time span to July 2. We saw the URL of the story that accounted for the spike, and saw that page had more views than the home page that day (the home page is number two in the list below):
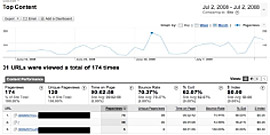
By clicking on that URL in Google Analytics, and also by calling up the actual page on the website, we were able to see that the story was our coverage of a local event, a type of story we hadn’t done in surrounding day. We also saw that most of the traffic to that story was “direct” …
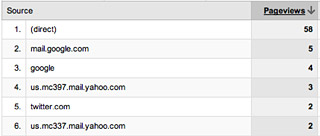
… meaning people had probably sent it around via e-mails or perhaps via instant messaging, neither of which were tracked by the analytics software. A lot of the other traffic was from e-mail software that was tracked, as you can see.
Bottom line
We ramped up event coverage and planned to e-mail people who were at the events to tell them we’d written a story, so they’d look and send it around.